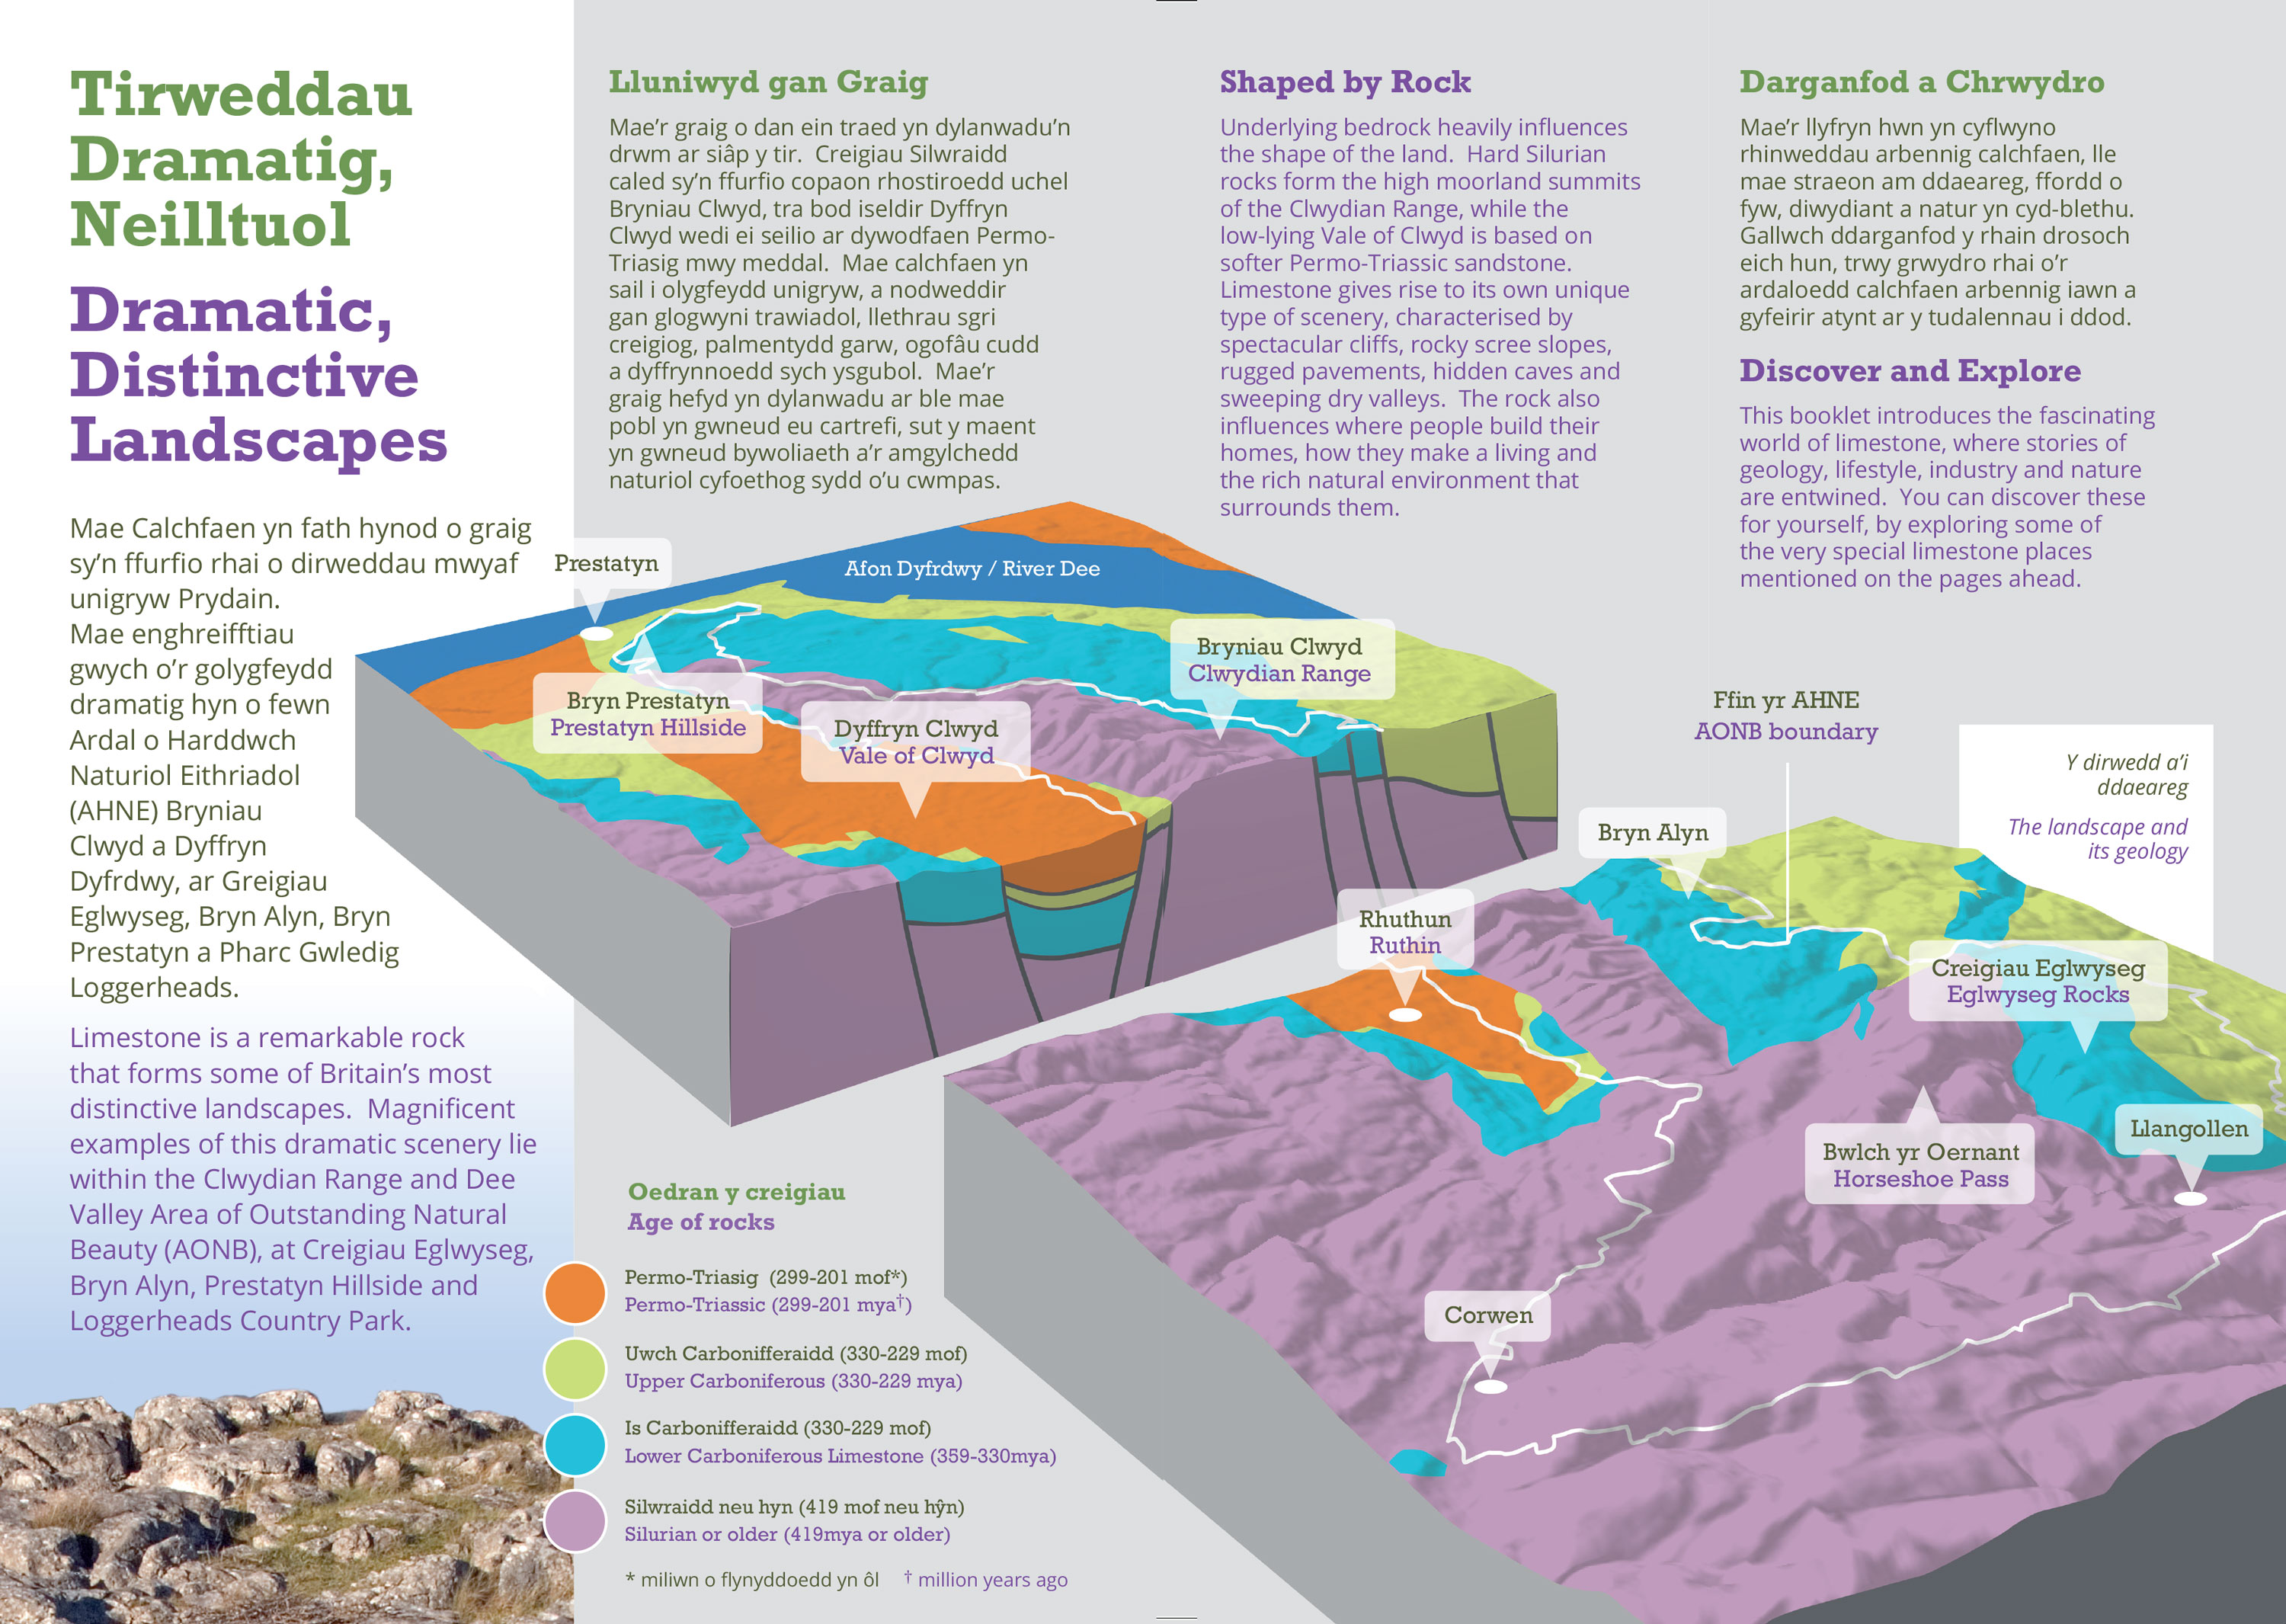
This was an illustration to depict the geology of an area for a booklet about limestone, with a cutaway to show the faults and rock strata.
I used open source terrain data for a shading map. Once I had that I pulled it into Google Earth as an overlay so that I could choose an angle. When correctly lined up with the map, the software showed me how the area looked in relief.
I worked from mapping data and sketches that the client’s geologist provided for the depth formation and then split the illustration to show that.

It was quite a bit more work than I’d anticipated but fascinating to work on, and looked great in the final booklet.